
Starting with Jupyter Book
Contents
Starting with Jupyter Book#
First, you need to install Jupyter Book to your existing environment. If you don’t have Anaconda , I suggest you download one here to get the conda environment.
Once you have conda environment, you can simply launch command prompt of Anaconda and write the magical installation code piece:
conda install -c conda-forge jupyter-book
It might take some time, stay tight, Once it is completed, you can take a deep breath! Now it is time to write your first Jupyter Book!
Go to Anaconda command prompt window and type the following command:
jupyter-book create mynewbook/
This command will create a book called mynewbook. You can name anything you like!
This will create the following files :
A configuration file (_config.yml)
A table of contents file (_toc.yml)
And your book’s content (this will be your new playground!)
If you are impatient like me and see the book on your browser, you need to build your book’s HTML! Go ahead and type the following command:
jupyter-book build mynewbook/
This will create a series of html files under the same directory. And you can click that html file to launch your new book on your browser!
Markdown + notebooks#
As it is markdown, you can embed images, HTML, etc into your posts!

You can also \(add_{math}\) and
or
But make sure you $Escape $your $dollar signs $you want to keep!
MyST markdown#
MyST markdown works in Jupyter Notebooks as well. For more information about MyST markdown, check out the MyST guide in Jupyter Book, or see the MyST markdown documentation.
Code blocks and outputs#
Jupyter Book will also embed your code blocks and output in your book. For example, here’s some sample Matplotlib code:
from matplotlib import rcParams, cycler
import matplotlib.pyplot as plt
import numpy as np
plt.ion()
<matplotlib.pyplot._IonContext at 0x17ba47cbb88>
# Fixing random state for reproducibility
np.random.seed(19680801)

N = 10
data = [np.logspace(0, 1, 100) + np.random.randn(100) + ii for ii in range(N)]
data = np.array(data).T
cmap = plt.cm.coolwarm
rcParams['axes.prop_cycle'] = cycler(color=cmap(np.linspace(0, 1, N)))


from matplotlib.lines import Line2D
custom_lines = [Line2D([0], [0], color=cmap(0.), lw=4),
                Line2D([0], [0], color=cmap(.5), lw=4),
                Line2D([0], [0], color=cmap(1.), lw=4)]

fig, ax = plt.subplots(figsize=(10, 5))
lines = ax.plot(data)
ax.legend(custom_lines, ['Cold', 'Medium', 'Hot']);
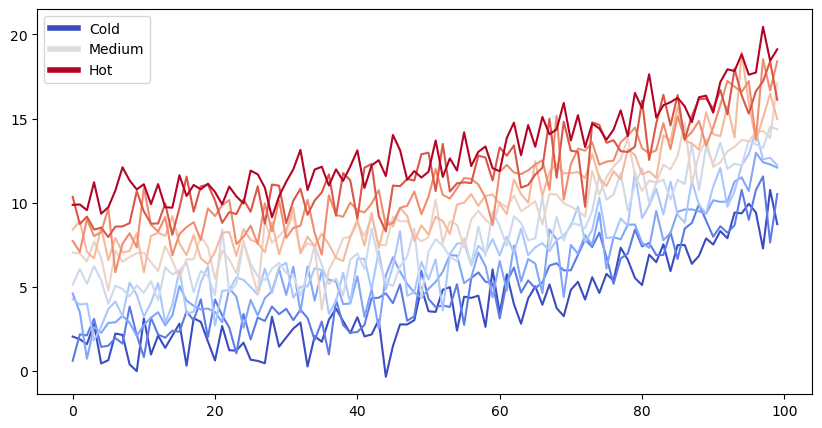
There is a lot more that you can do with outputs (such as including interactive outputs) with your book. For more information about this, see the Jupyter Book documentation